You pay your plumber $30 an hour. So you bill $35 and pocket $5, right?
That math has buried more contractors than any slow season. By the time you count payroll taxes, workers' comp, the truck, the insurance, and the hours you pay for but can't bill, that $30 tech costs you $50 to $55 an hour before you make a dime.
Here's the deal: this guide walks the full chain with real numbers. We start from actual Bureau of Labor Statistics wage data for four trades, add every cost hiding behind the base wage, and land on a billing rate that holds up. No made-up "$80 per hour" example figures - the kind most labor cost articles use - just your tech's real paycheck math.
Let's break this down.
What Construction Labor Actually Pays (BLS Wage Data)
Labor runs 40-60% of total project cost - the biggest controllable expense on most jobs (BuiltSimple, 2025). So what does the labor itself cost? Here's what the trades actually earn, straight from the Bureau of Labor Statistics (BLS OEWS, May 2023 - the latest published survey):
| Trade | P25 | Median | P75 | P90 | US Employment |
|---|---|---|---|---|---|
| Electricians (SOC 47-2111) | $23.13 | $29.61 | $38.59 | $50.09 | 712,580 |
| Plumbers (SOC 47-2152) | $22.99 | $29.59 | $38.56 | $49.59 | 436,160 |
| HVAC techs (SOC 49-9021) | $22.38 | $27.55 | $34.19 | - | 397,450 |
| Roofers (SOC 47-2181) | $21.23 | $24.05 | $29.97 | - | 129,300 |
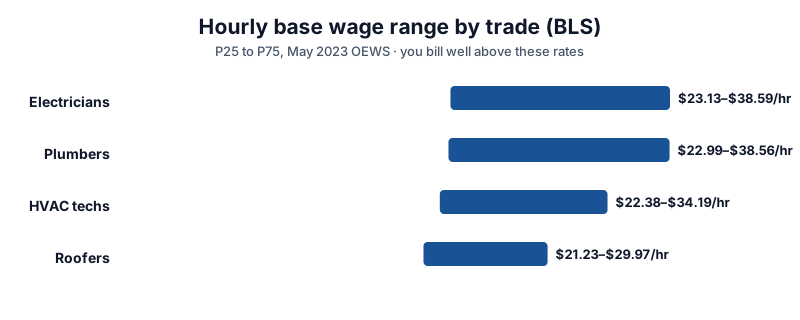
Three things jump off that table.
First, the medians cluster between $24 and $30. If you're paying much below P25, you're fishing in the shallow end of the labor pool - and 76% of construction firms reported trouble finding qualified workers in 2025 (AGC of America, 2025). Cheap labor isn't cheap when the position sits open for two months.
Second, the spread inside each trade is huge. A P90 electrician at $50.09 makes 69% more than the median. Your senior foreman and your second-year apprentice are not the same line item, and your estimates shouldn't price them that way.
Third, location swings these numbers hard. BLS state data shows Illinois electricians averaging $42.33 an hour against a national average of $32.60, and high-cost metros run higher still. If you bid with national medians in a high-wage state, you're building in a loss. Pull your own state's numbers from the BLS OEWS tables before you trust any figure - including ours.
And once you know your rate, ask where those hours go. For electricians wondering what a billable hour is worth when it goes to spreadsheet estimating instead of wiring, our Excel-to-software switch guide for electrical work runs that math by crew size.
Now, here's what that table doesn't show. These are wages - what hits your tech's W-2. What hits your wallet is a different number entirely.
The Costs Hiding Behind the Base Wage
Every hour you buy from a tech comes with a stack of invisible add-ons. Here's the honest list for a typical small contractor:
| Cost item | Typical rate | On a $29.59 median plumber | Hard data or typical? |
|---|---|---|---|
| FICA (Social Security + Medicare, employer share) | 7.65% | $2.26 | Federal law - fixed |
| FUTA + SUTA unemployment | 1-5% of first wages | ~$1.04 | Fixed by law, varies by state |
| Workers' comp | $3-6 per $100 payroll (plumbing class code) | $0.89-$1.78 | Varies by state and claims history |
| Health insurance | $450-650/mo employer share | ~$3.18 | Market typical |
| Service truck, fuel, insurance | $900-1,100/mo | ~$5.78 | Market typical |
| Tools and consumables | 1-3% of payroll | $0.30-$0.89 | Rule of thumb |
Add the column and the burden lands around $13-15 an hour on a median-wage plumber. That's a 45-50% burden rate - and it matches what payroll firms quote small contractors in the trades.
Two details in that table deserve a closer look.
Workers' comp swings by trade, not just by state. Roofing class codes run $10-20 per $100 of payroll in many states - roughly triple a plumbing code. An HVAC crew with refrigerant handling sits in between. If you run mixed crews, each trade needs its own burden math, not one company-wide multiplier.
The truck line is the one solo operators miss most. A van with payment, commercial insurance, fuel, and maintenance runs $900-1,100 a month in most markets - and it's a labor cost, because without it your tech doesn't reach the job. Priced against a 40-hour week, it's $5-6 an hour before the tech turns a wrench.
Here's where it gets interesting. We're not done stacking costs yet.
The Full Math: From $29.59 to a Rate That Pays You
Burden tells you what an hour costs. It doesn't tell you what a billable hour costs - and those aren't the same thing. Walk the full chain:
Step 1 - Start with the real wage. BLS median plumber: $29.59.
Step 2 - Add the burden. Using the midpoints from the table above: roughly $13.60. Your fully burdened cost is now about $43.20 an hour.
Step 3 - Adjust for hours you can't bill. You pay for 2,080 hours a year (40 × 52). Nobody bills 2,080. Holidays, sick days, rain days, warehouse runs, drive time between jobs, and time spent fixing the estimator's mistakes eat the calendar. Most contractors bill 1,500 to 1,700 hours per field tech per year - a common industry rule of thumb. At 1,700 billable hours, every billable hour has to carry 2,080/1,700 = 1.22 hours of cost:
$43.20 × 1.22 = $52.70 per billable hour
That's your break-even. Before profit. Before overhead that isn't in the burden - office rent, estimating software, your own salary as the owner. How big is that layer? Typical shops carry 25-45% of revenue in overhead - see our overhead benchmarks guide for the ranges by trade and company size.
Step 4 - Add margin, then check it against the market. Mark up $52.70 by a modest 20-30% and you land between $63 and $69 an hour. Now check the market: typical plumbing billing rates run $75-200 an hour (industry common rates, not BLS data - the BLS tracks wages, not invoices), with emergency calls past $250.
The market isn't being generous. It's covering exactly the chain you just walked.
Now flip the math and see why cheap bids lose money. Bill $55 an hour because a competitor quoted low, and you're collecting $2.30 over your break-even per tech-hour - before the owner takes a dollar. A 3-hour job nets you less than $7 of pre-overhead margin. Do that on every job and you've bought yourself a busy year and a dead company.
Which brings up the question every estimator should ask: how do you get from a job's scope to the right number of hours?
The Billable Hours Trap Most Estimates Miss
You did a $6,000 job and made $400. The material estimate was fine. What happened?
This is usually it. The estimate priced 60 tech-hours at burdened cost - but the job took 80, and nobody's spreadsheet made a noise. Hours overrun quietly because labor math hides three traps:
Trap 1 - pricing paid hours, not productive hours. If your estimate says "6 hours for the water heater swap," ask whether that's 6 hours on site or 6 hours including the parts run, the drive, and the cleanup. The honest number is usually the second one.
Trap 2 - one blended rate for the whole crew. Your $50 master and your $22 second-year aren't one average tech. BLS shows a P10-to-P90 spread of nearly 3x inside a single trade. Price tasks to the person who'll actually do them - apprentice hours on demo, master hours on the final connections and inspection.
Trap 3 - forgetting the learning curve on new work types. First-time jobs always overrun. If you're bidding a work type you've done fewer than five times, add 15-25% to the labor hours and say so in your own notes. You can't put "we've never done this" on the customer's invoice, but you can price it.
The fix for all three is the same: track actual hours against estimated hours on every completed job. After 20 jobs you'll know your real billable-hours ratio and your real overrun factor - and your estimates stop being guesses wearing a spreadsheet.
Where Estimates Go Wrong: Three More Costly Mistakes
Beyond the traps above, three labor costing mistakes show up again and again when contractors review lost-margin jobs:
Mistake 1 - copying a billing rate from the internet. Rates you see online are averages across markets, company sizes, and overhead structures. Your rate comes from your wage, your state's comp codes, and your truck payment. Use the method above, not somebody else's answer.
Mistake 2 - marking up materials but not labor. A 20% markup on materials while labor runs at break-even is a wash on most residential jobs - labor is the bigger number. If you're only marking up one line, you're marking up the wrong one. Our markup calculator runs both scenarios side by side - and markup vs margin shows why a 20% markup only earns you a 17% margin, a gap that compounds across every bid.
Mistake 3 - never revisiting the wage number. If your estimates still carry a $26 wage from two years ago, every bid is quietly underwater. Wages in the trades have moved - the BLS medians above are the latest published survey, and your local market may have moved further. Re-check your base rates at least twice a year, and after any hiring round that reset your pay scale.
That's the full error list. Now let's put the whole method into a bid.
Putting the Math Into Your Next Bid
Here's the workflow, start to finish:
- Pull your real wage. Your techs' actual pay, or the BLS median for your trade if you're hiring. For trade-specific numbers, the BLS OEWS tables are free and searchable by state.
- Build your burden rate once. FICA is fixed at 7.65%. Get your comp rate from your insurer or state fund - it's printed on your policy. Add your real insurance and truck costs. You now have a per-tech cost you can reuse on every estimate.
- Price hours to the task, not the average tech. Split the job into steps, assign the tech who'll actually do each one, and price the hours honestly - including drive and material runs.
- Apply your billable-hours factor. Divide 2,080 by your tracked billable hours (start with 1,700 until you have your own number), multiply your burdened rate, then add markup.
For worked examples trade by trade, our plumbing bid pricing guide walks a full water heater replacement estimate, and the cost guides hub has per-project labor breakdowns for two dozen project types. If you're still building estimates in spreadsheets, why 67% of contractors still use Excel covers when that stops scaling - and what trips up the switch.
Those rates only pay off if the quantities feeding them are right. Takeoff vs estimate breaks down where the counting step fits in your bids - and what a missed line item costs by the time it reaches your price.
Bottom line: your $30-an-hour tech costs $52-55 to field, before profit. Every bid you price below that chain is a donation. Run the math once with your own numbers, and the market's going rates - the $75-200 you see plumbers charging - stop looking greedy and start looking like arithmetic.
Frequently Asked Questions
What percentage of a construction project is labor?
Labor typically runs 40-60% of total project cost, making it the largest controllable expense on most jobs (BuiltSimple, 2025). On labor-heavy service work like plumbing repairs, labor can run higher still. Material-heavy projects - roofing re-roofs, for example - flip the ratio toward materials.
What is a fully burdened labor rate in construction?
A fully burdened rate is the base wage plus every employer-side cost: FICA at 7.65%, unemployment taxes, workers' comp, health insurance, and vehicle costs. For a median-wage tradesperson, burden typically adds 45-50% on top of base pay - a $29.59 median plumber costs about $43 an hour fully burdened.
How do I calculate my labor burden rate?
Start with the wage, then add the fixed pieces: FICA is 7.65% by federal law, FUTA and SUTA run 1-5% depending on your state. Pull workers' comp from your policy - trade class codes vary from roughly $3 to $20 per $100 of payroll. Add your actual health insurance premium and vehicle costs, divided across monthly hours. The method above walks it step by step.
What's the difference between billable hours and paid hours?
Paid hours are what you write checks for - typically 2,080 a year for a full-time tech. Billable hours are the subset you can charge to jobs. Holidays, sick days, drive time, parts runs, and shop time eat the calendar, and most contractors bill 1,500-1,700 hours per tech per year. Every billable hour must carry the cost of the non-billable ones - that's the 1.22 multiplier in the math above.
Should I use one labor rate for my whole crew?
No. BLS data shows a 3x wage spread between P10 and P90 inside a single trade, and your crew likely spans apprentice to master. One blended rate overcharges simple work and undercharges skilled work - and hides which jobs actually make money. Price each task at the wage of the person doing it.
How often should I update my labor rates for estimating?
At least twice a year, and after any event that changes your costs: a pay raise round, a comp policy renewal, a new truck, or a health premium change. The BLS OEWS data publishes annually - the May 2023 survey is the latest in our tables - but your own costs move on their own schedule.
Is $50 an hour a good labor rate to charge?
Depends on which side of the break-even it lands. The chain above turns a $29.59 median wage into roughly $52.70 of cost per billable hour - so $50 collected on a median-wage tech loses money before overhead. If your techs earn below median, $50 can work; if they're at or above it, you're subsidizing the job. Run your own numbers before matching a competitor's rate.
Disclaimer: Wage figures are from the U.S. Bureau of Labor Statistics, Occupational Employment and Wage Statistics (OEWS), May 2023 survey. Billing rate ranges are industry common rates, not BLS data. Insurance and vehicle costs are market-typical figures - confirm your actual costs with your insurer, payroll provider, and accountant. This article is for educational purposes and is not financial, legal, or tax advice.